What’s measured is improved.
As a public health provider or dental provider, you probably agree that can’t be emphasized enough.
Consistent, measured improvement in healthcare and dentistry relies on tracking key metrics (KPIs).
We’ll go record to confirm that a dedicated dental analytics platform and dental dashboards make that possible.
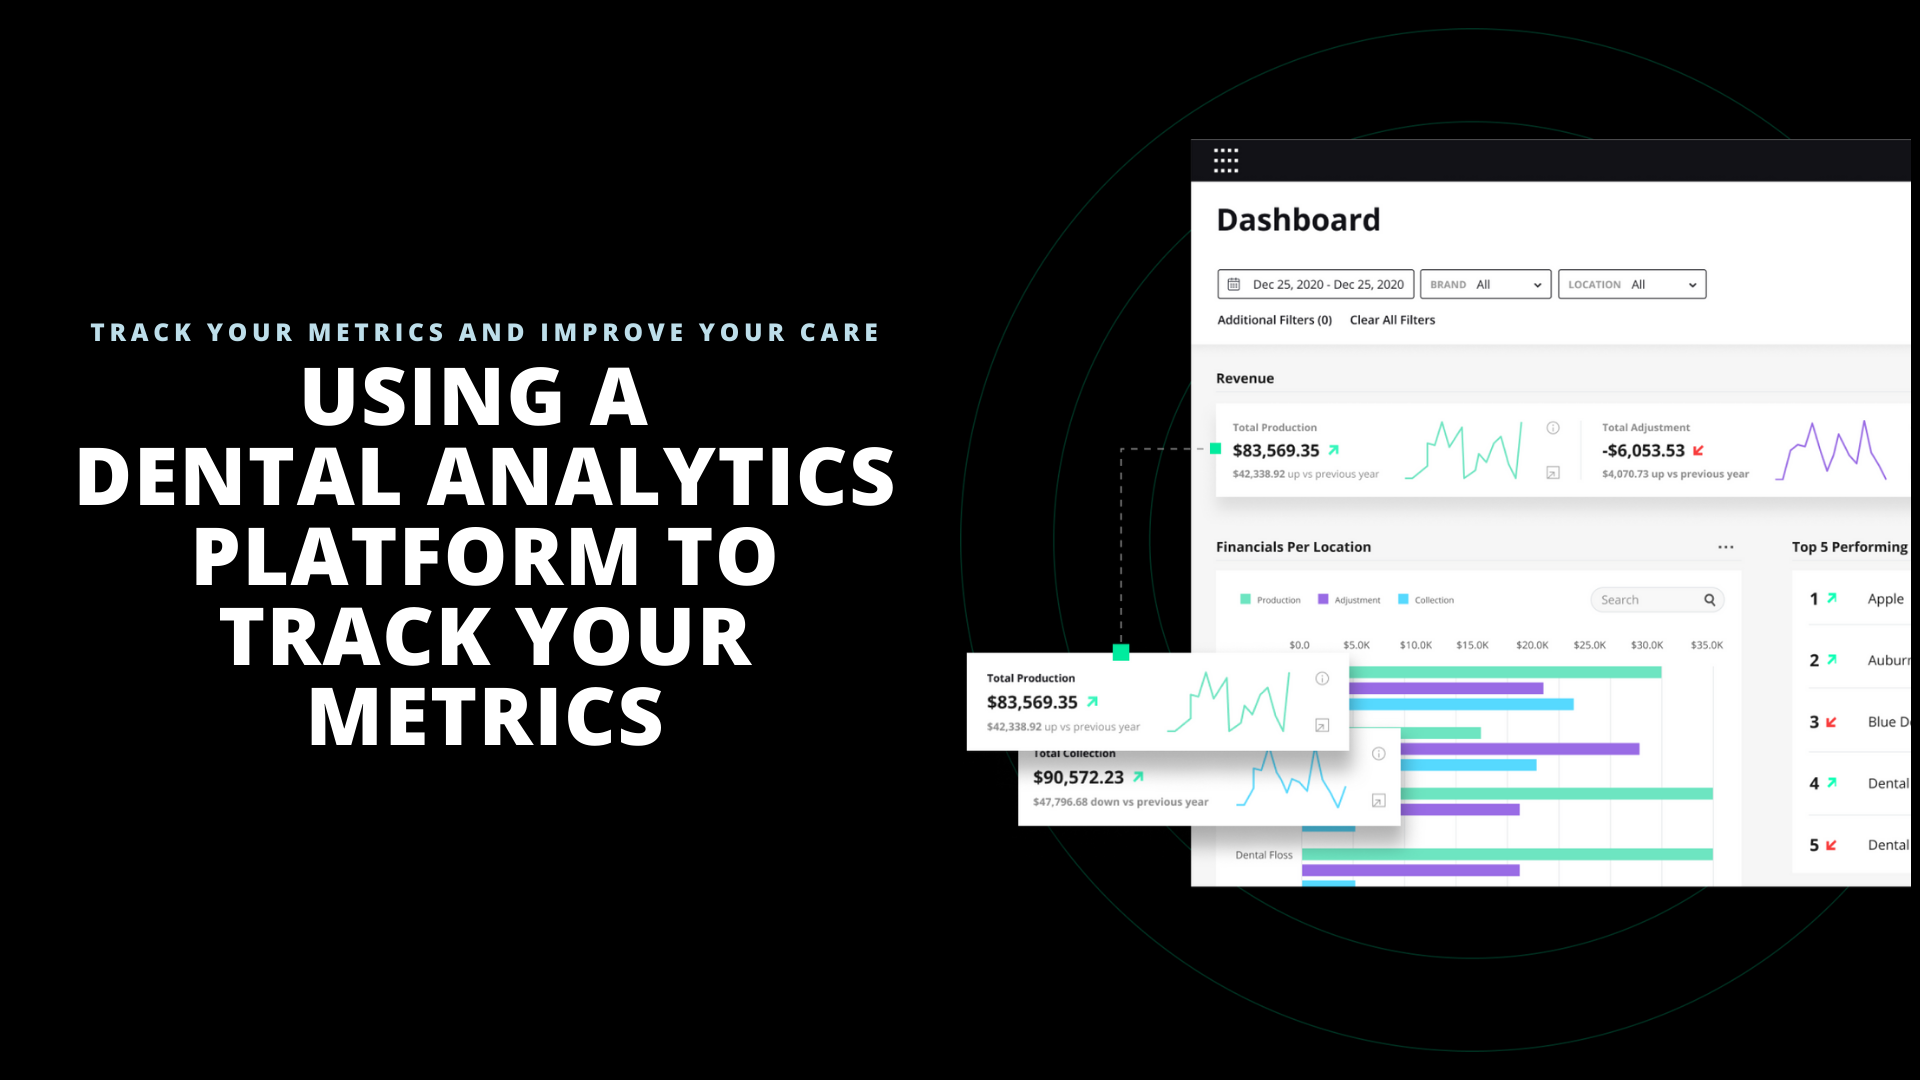
Track your metrics & improve your care
Data overwhelm is real.
It’s no wonder that many health and dental providers prefer to keep their heads down doing the core work of treatment.
Even so, your ongoing ability to provide the highest care standards requires that you track your organization’s health.
Understand that no one is asking you to track every tedious strand of data.
But it is essential to narrow your data perspective to those key areas that drive your success as a healthcare provider or dental provider. Your ability to visualize and interact with your core data categories keeps you informed and invested in your patient’s care outcomes.
Compartmentalize your metrics – maximize your care (this is where a dashboard steps up)
1- Incoming patients
Patient flow (or volume) data gives you perspective about who you’re treating, when and how long, and how they’re connecting with you.
Think of your fundamental patient data this way:
-
- How many patients and what type of treatment?
- When are they scheduling and what’s the duration of their visit?
- How did they find you and/or who referred them?
This layer of patient data gives you valuable insight into your community’s awareness about your services, how you attract or market to them, and what health outcomes they’re trusting you to provide.
2- Revenue streams
The lifeblood of your organization is consistent revenue flow. Financial leaks or mismanaged resources and opportunities can (no doubt) hinder patient care.
It makes sense to give attention to revenue stream KPIs.
-
- Who is cancelling appointments or no-showing?
- Who requires a referral outside of your office/practice?
- Who is being rescheduled as a result of your (provider) schedule or unavailability?
A large volume of your revenue stream consists of your patient appointment flow. Strategies for reminders, rescheduling, and follow-up can be supported within a dedicated dashboard category.
3- Services provided
It’s helpful to know what type of services your patients are utilizing. Alongside that data is having perspective on outcomes such as referrals and specific department resources that are being used.
Drill-down into key specifics such as:
-
- The number of appointments you/provider pool is completing
- What extended services (e.g. surgery, etc) are being provided and by whom?
- The appointments that are being scheduled within each department or specialty service.
Your utilized services can reveal useful data about patient need and preference. An equipped dashboard will cross-section your patient data around demographics that could produce improved or new service opportunities.
4- Care standards and quality
This KPI has a broad scope. It can include data from across your team(s) and extend to patient feedback relative to the care you and your team(s) provide.
Think:
-
- Team satisfaction levels
- The patient experience within your clinic/office/practice and each internal department
- Post-treatment data that could include reappointment/readmission, clinical outcomes, treatment setbacks (e.g. post-op complications, infection, etc), procedural errors, patient wait-times and appointment pace.
These deserve consistent monitoring within your dashboard. Your ability to maximize your care relies on attention to those areas where improvement is essential.
KPIs tell the truth. What you do with the data is the difference between quality and status quo.
Metrics and KPIs are a vital quality-control tools. Listen, learn, and leverage them on behalf of your care standards within your team(s) and across all departments.
5- Income generators
Consider this KPI to be a deeper dive into your revenue stream. It focuses more on what’s driving your income.
-
- Per provider
- Per department/team
- Per service or specialty
Also, measure the costs/expenses per each of the above. You’ll want to see where this metric zone aligns with your other revenue stream data.
Your profitability forecast and reality depend on the informed decisions you make around your discoveries. The same applies to all related areas of your patient care environment.
Check out the following resources to gain more insight into how you can effectively perform data analysis on a dedicated dashboard – with emphasis on dentistry:
Take Advantage of the Future of Analytics in Dentistry
What KPIs to Track When You Use a Dental KPI Dashboard?
3 Tips on Optimizing Your Dental Practice Operations with A Dental Dashboard
Why not use an all-in-one dental KPI dashboard for maximizing DSO, group practice, and solo private practice patient care data?
The Jarvis Analytics platform helps assure that you’re tracking the important metrics and staying on track with your goals as your dental practice and/or DSO grows and expands.
Jarvis…
- Integrates seamlessly with your chosen practice management software/platform
- Presents the metrics you want and need in an easy-to-view dental dashboard that reduces data complexity for growing dental practices, dental groups, and DSOs
Experience Jarvis in action. Request a demo today!
Or…
Contact us for more information about dental analytics that leads to profitability.
LIKE WHAT YOU SEE & READ?
Join thousands of other people, subscribe to our newsletter, and get valuable business tips delivered right to your inbox.